Investigate
Investigate allows for users to interrogate data via a sophisticated search engine that connects to a backend data lake. There is also dashboarding functionality that allows for various searches and visualisations to be saved for collaborative investigations.
Search Functions
Basic Search Syntax
Searching works via a simple syntax of values and operators. For example, to search for a host with the value "sa-1", the search query would look like the following:
host = "sa-1"
This can then be expanded by combining and and or operators with another filter.
host = "sa-1" and user = "bob"
Negative filters can also be used, such as the below:
host = "sa-1" and user != "bob"
Wildcards
Searching also supports wildcards. For example, if you knew that the host started with sa but you didn't know the rest, you could perform a search like the following:
host = "sa-*"
Alternatively, you could use * to signify that the field just needs to exists:
host = *
Piping
In order to chain filters and functions together, the pipe | operator is used. For example, to pipe a query that filters by host into a timechart (explained below), you can do the following:
host = "sa-1" | timechart(cpu)
Visualisations
Alongside the above operations, it is also possible to visualise data by piping to a specific function. The following functions are available: | Name | Syntax | Description | | -------- | ------- | ------- | | Timechart | timechart( fields, metric ) | A line graph of data over time, split by various fields | Piechart | piechart( fields, display ) | A piechart of data, with each slice representing a unique value and it's frequency in the data | Group | group( fields, metric ) | A table of selected fields that are grouped by their unique values | Select | select( fields, metric ) | A table of selected fields, with a row for each data entry | Count | count( field ) | The total count of the selected field occurrence | Sum | sum( field, round, unit ) | The total value of the selected field over a time period | Maximum | max( field, round, unit ) | The maximum value of the selected field over a time period | Average | avg( field, round, unit ) | The average value of the selected field over a time period | Minium | min( field, round, unit ) | The minimum value of the selected field over a time period
*fields represents the ability to specify multiple fields at once
Timechart
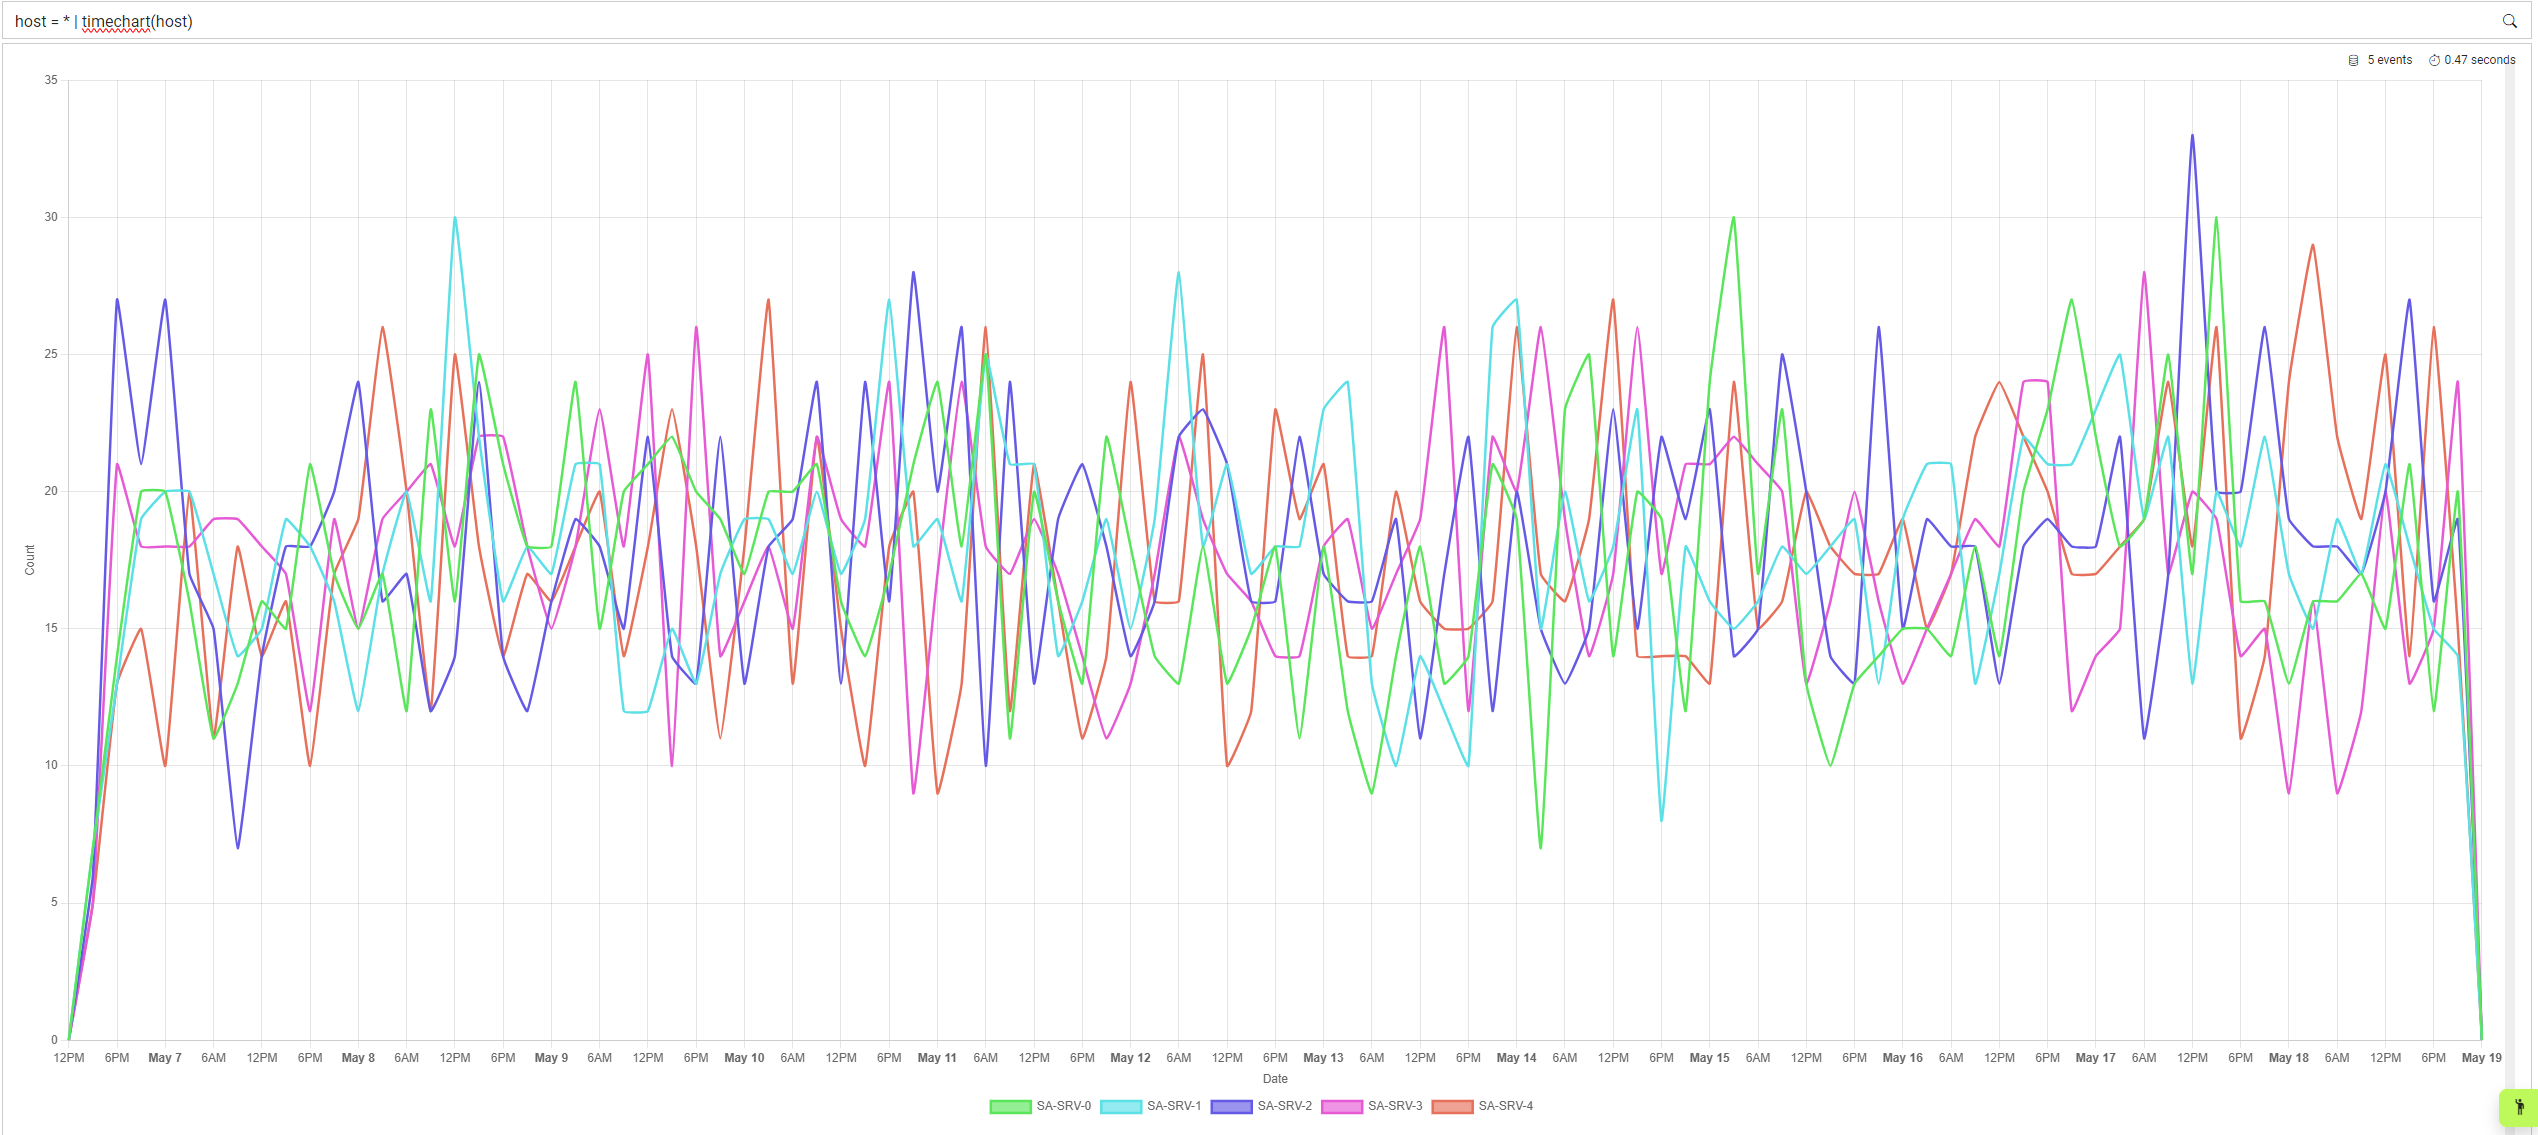
Timechart supports two parameters; the first is zero to an infinite amount of fields to split the data across. For example, if you wanted to see the number of events for each host, you could do the following:
host = * | timechart(host)
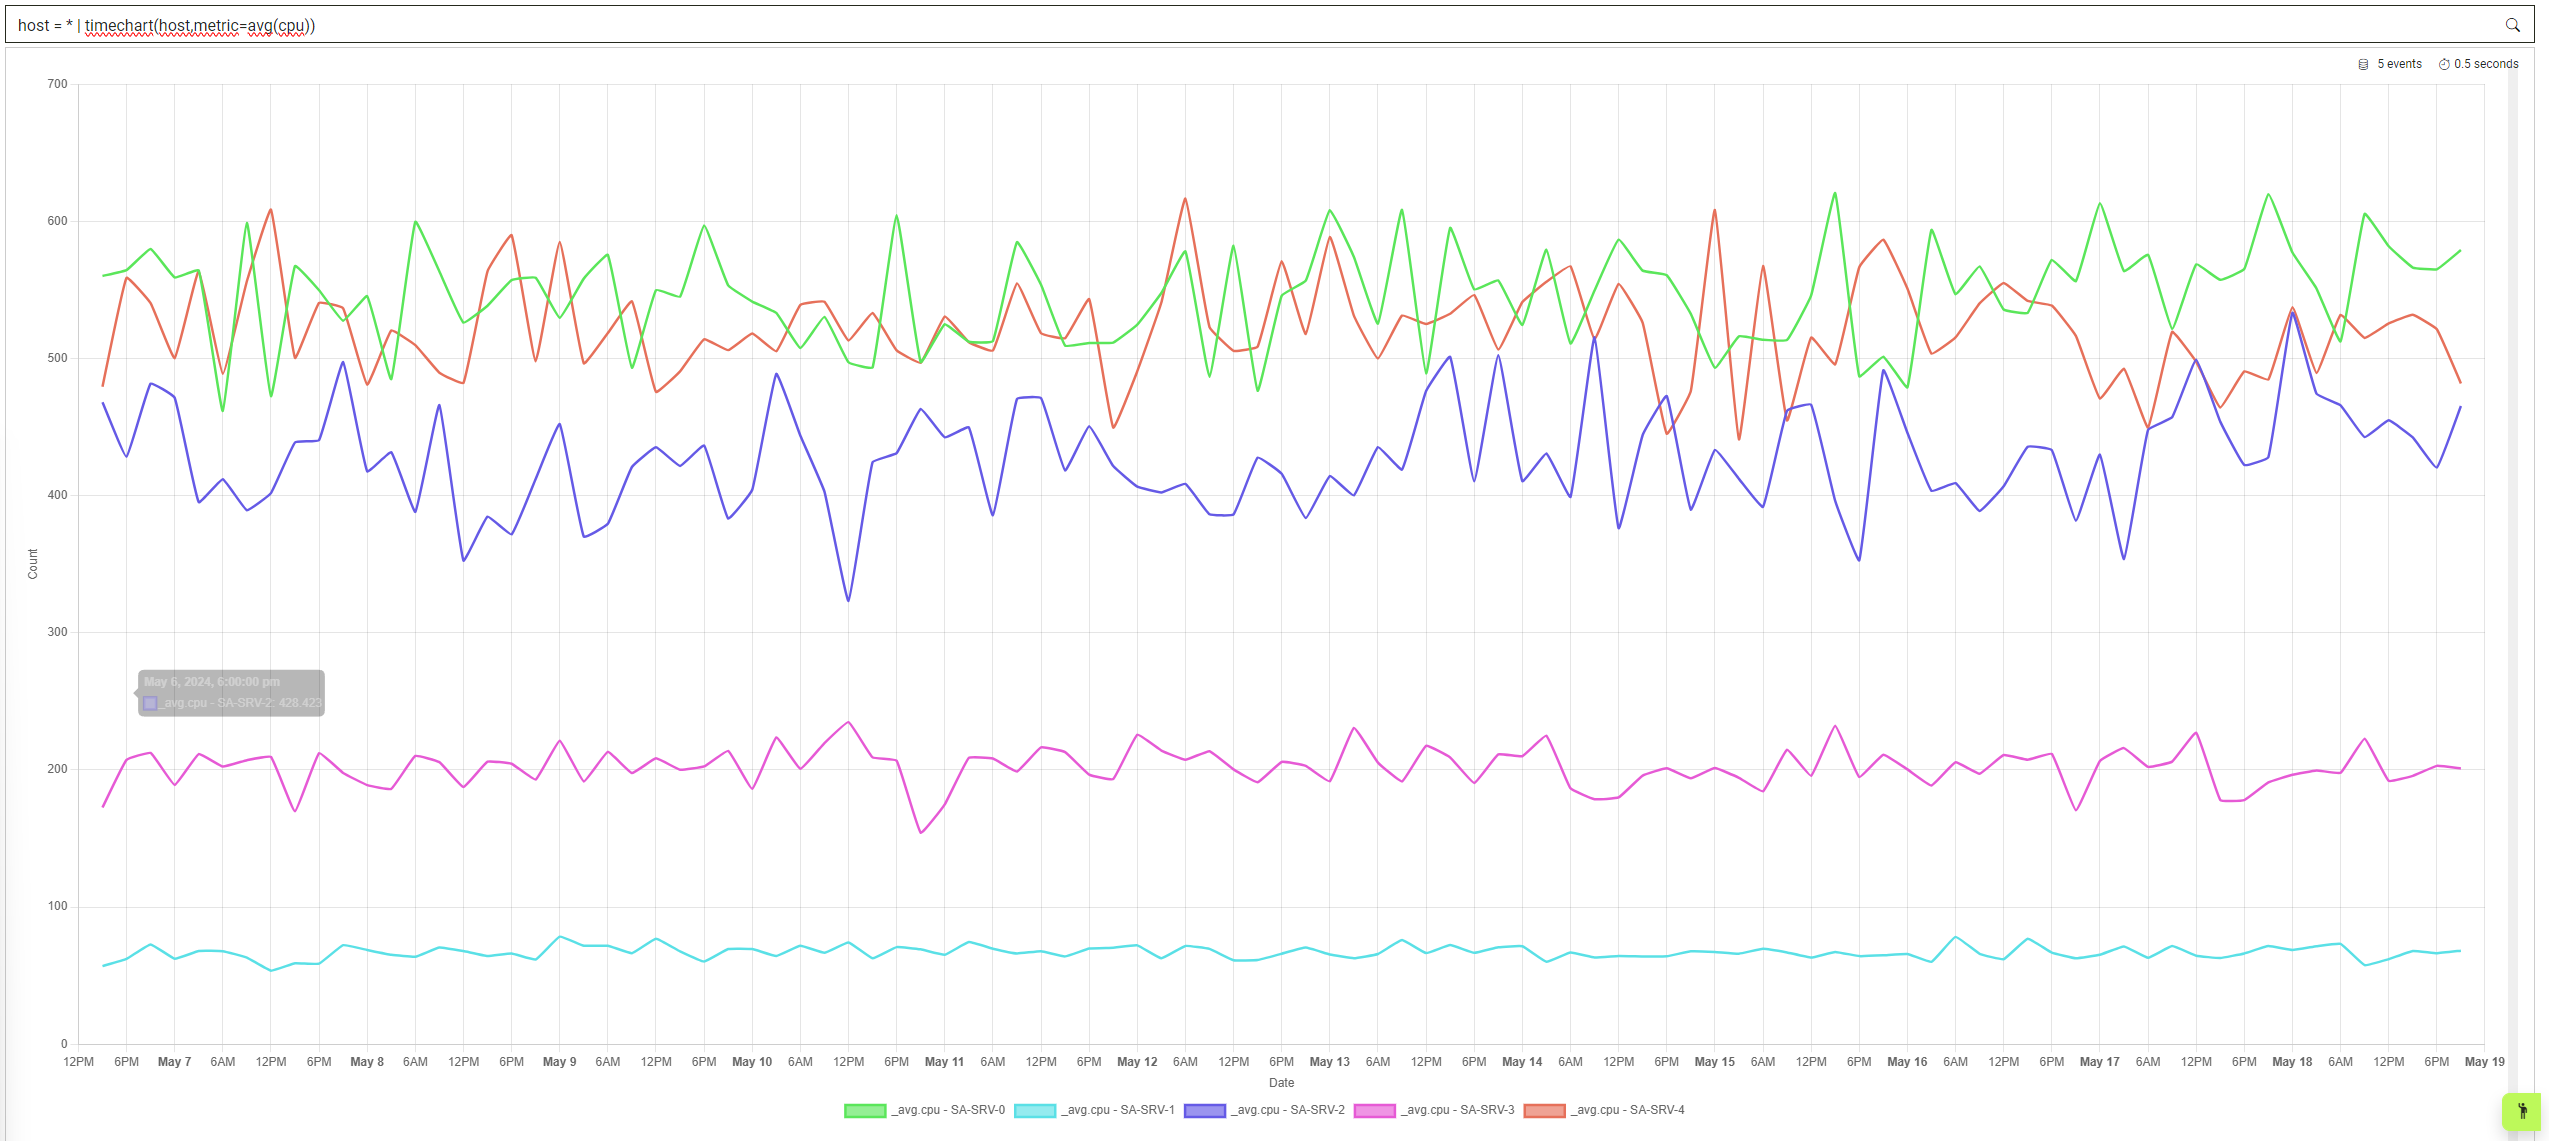
The second parameter is metrics to split the data over. In this case, if you wanted to see average cpu per host, you could write the following search:
host = * | timechart(host,metric=avg(cpu))
Piechart
Piechart supports two parameters; the first is one to infinite amount of fields to split the data across. For example, if you wanted to visualise the frequency of hosts within a timeframe, you could use the following query:
host = * | piechart(host)
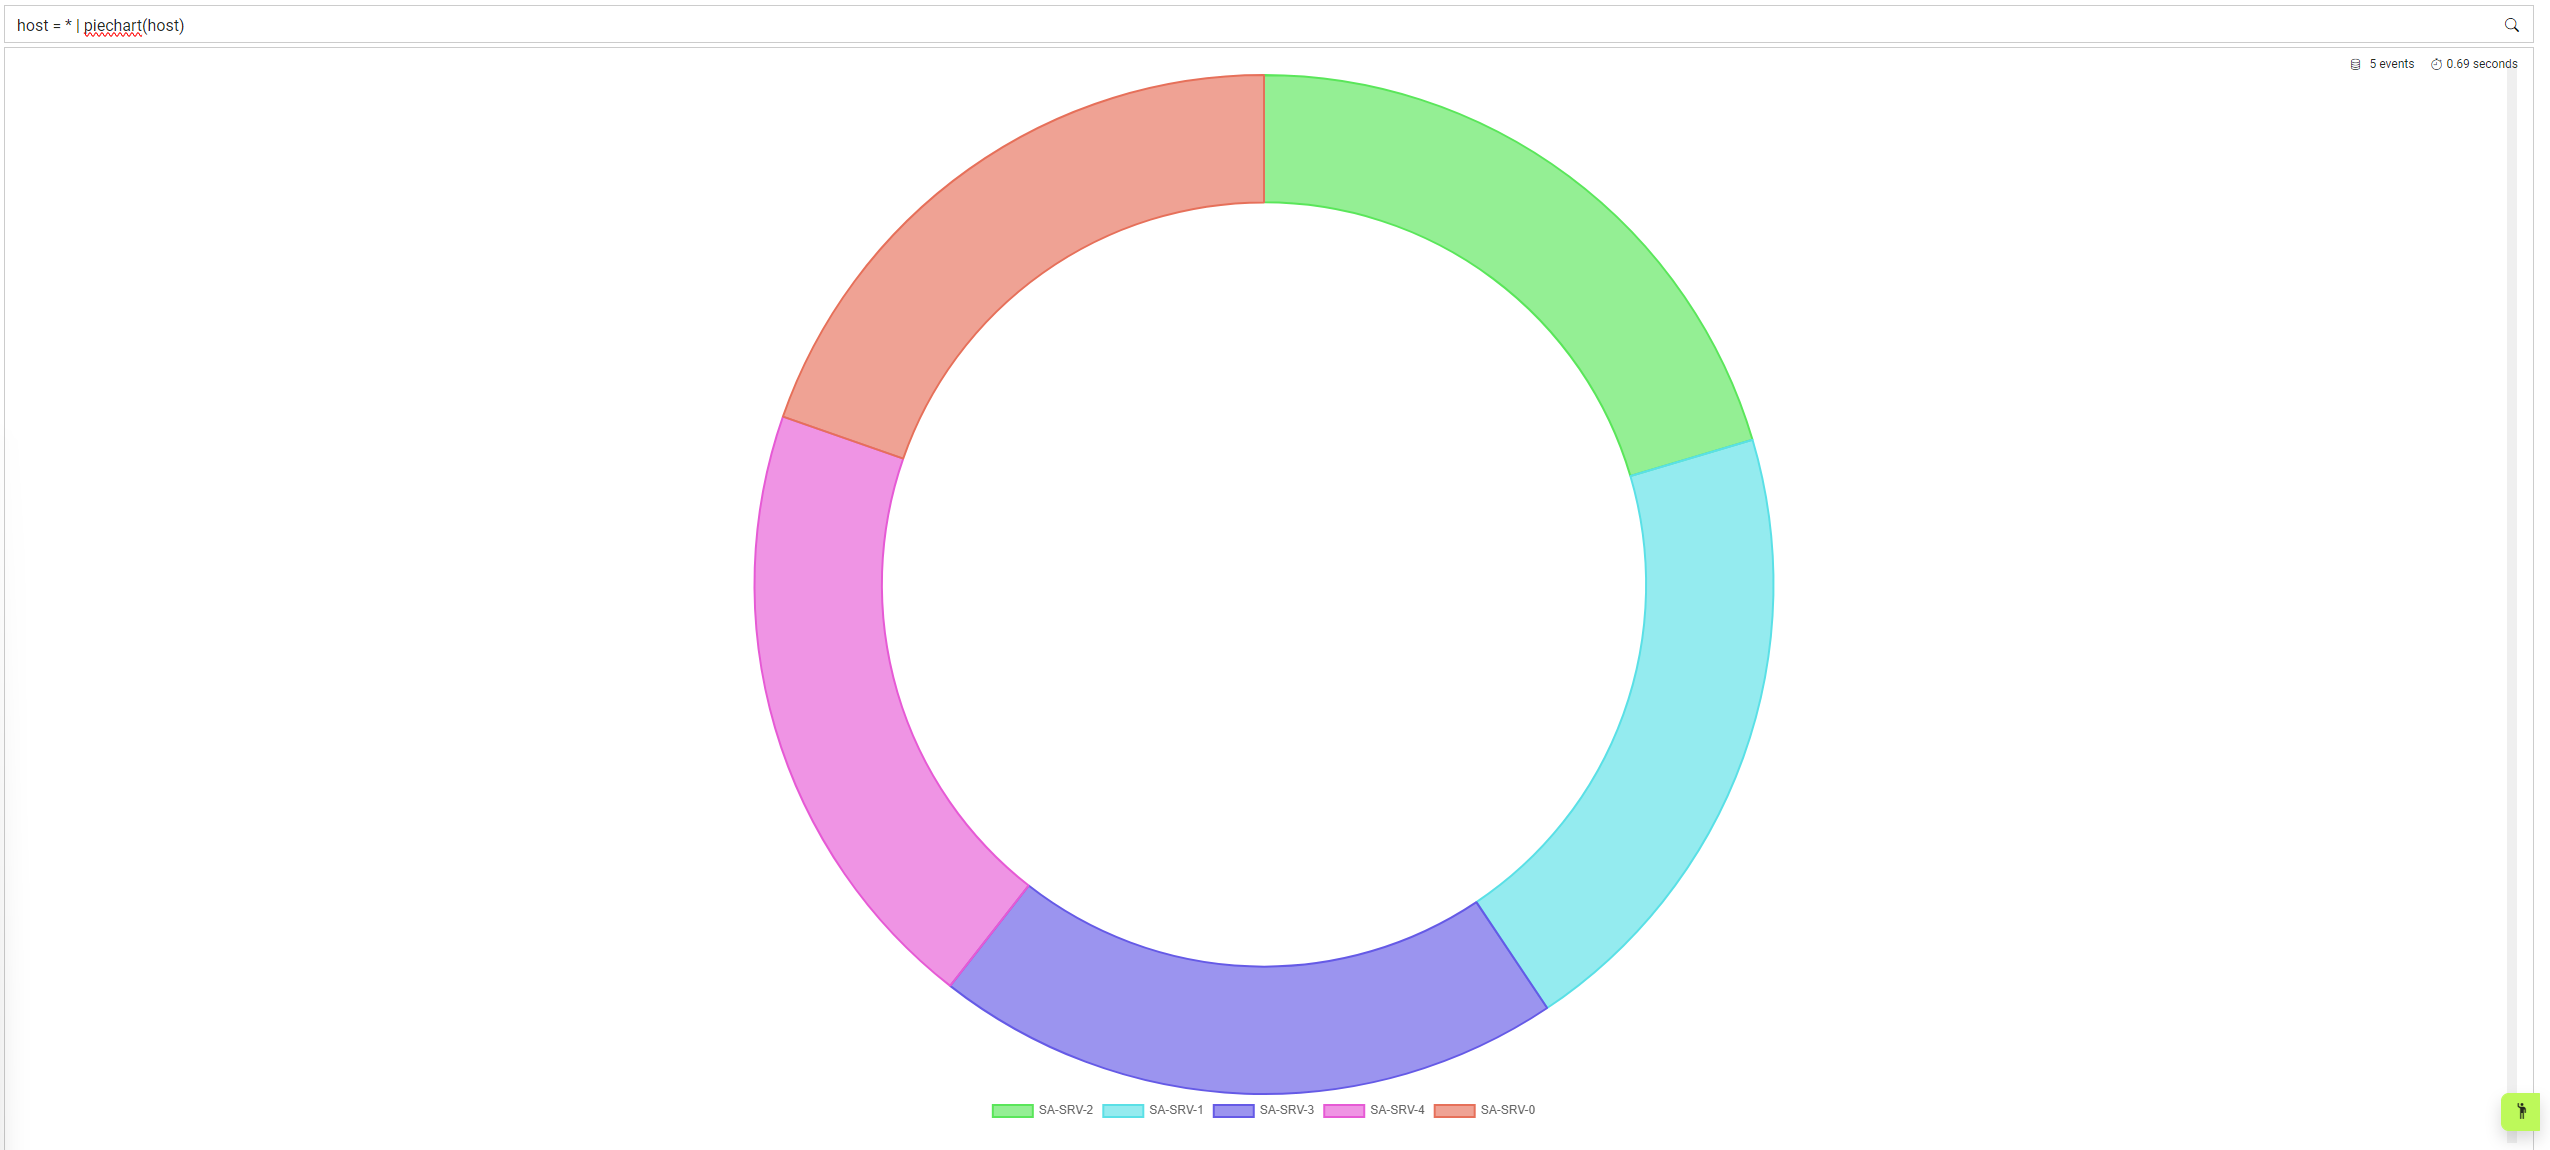
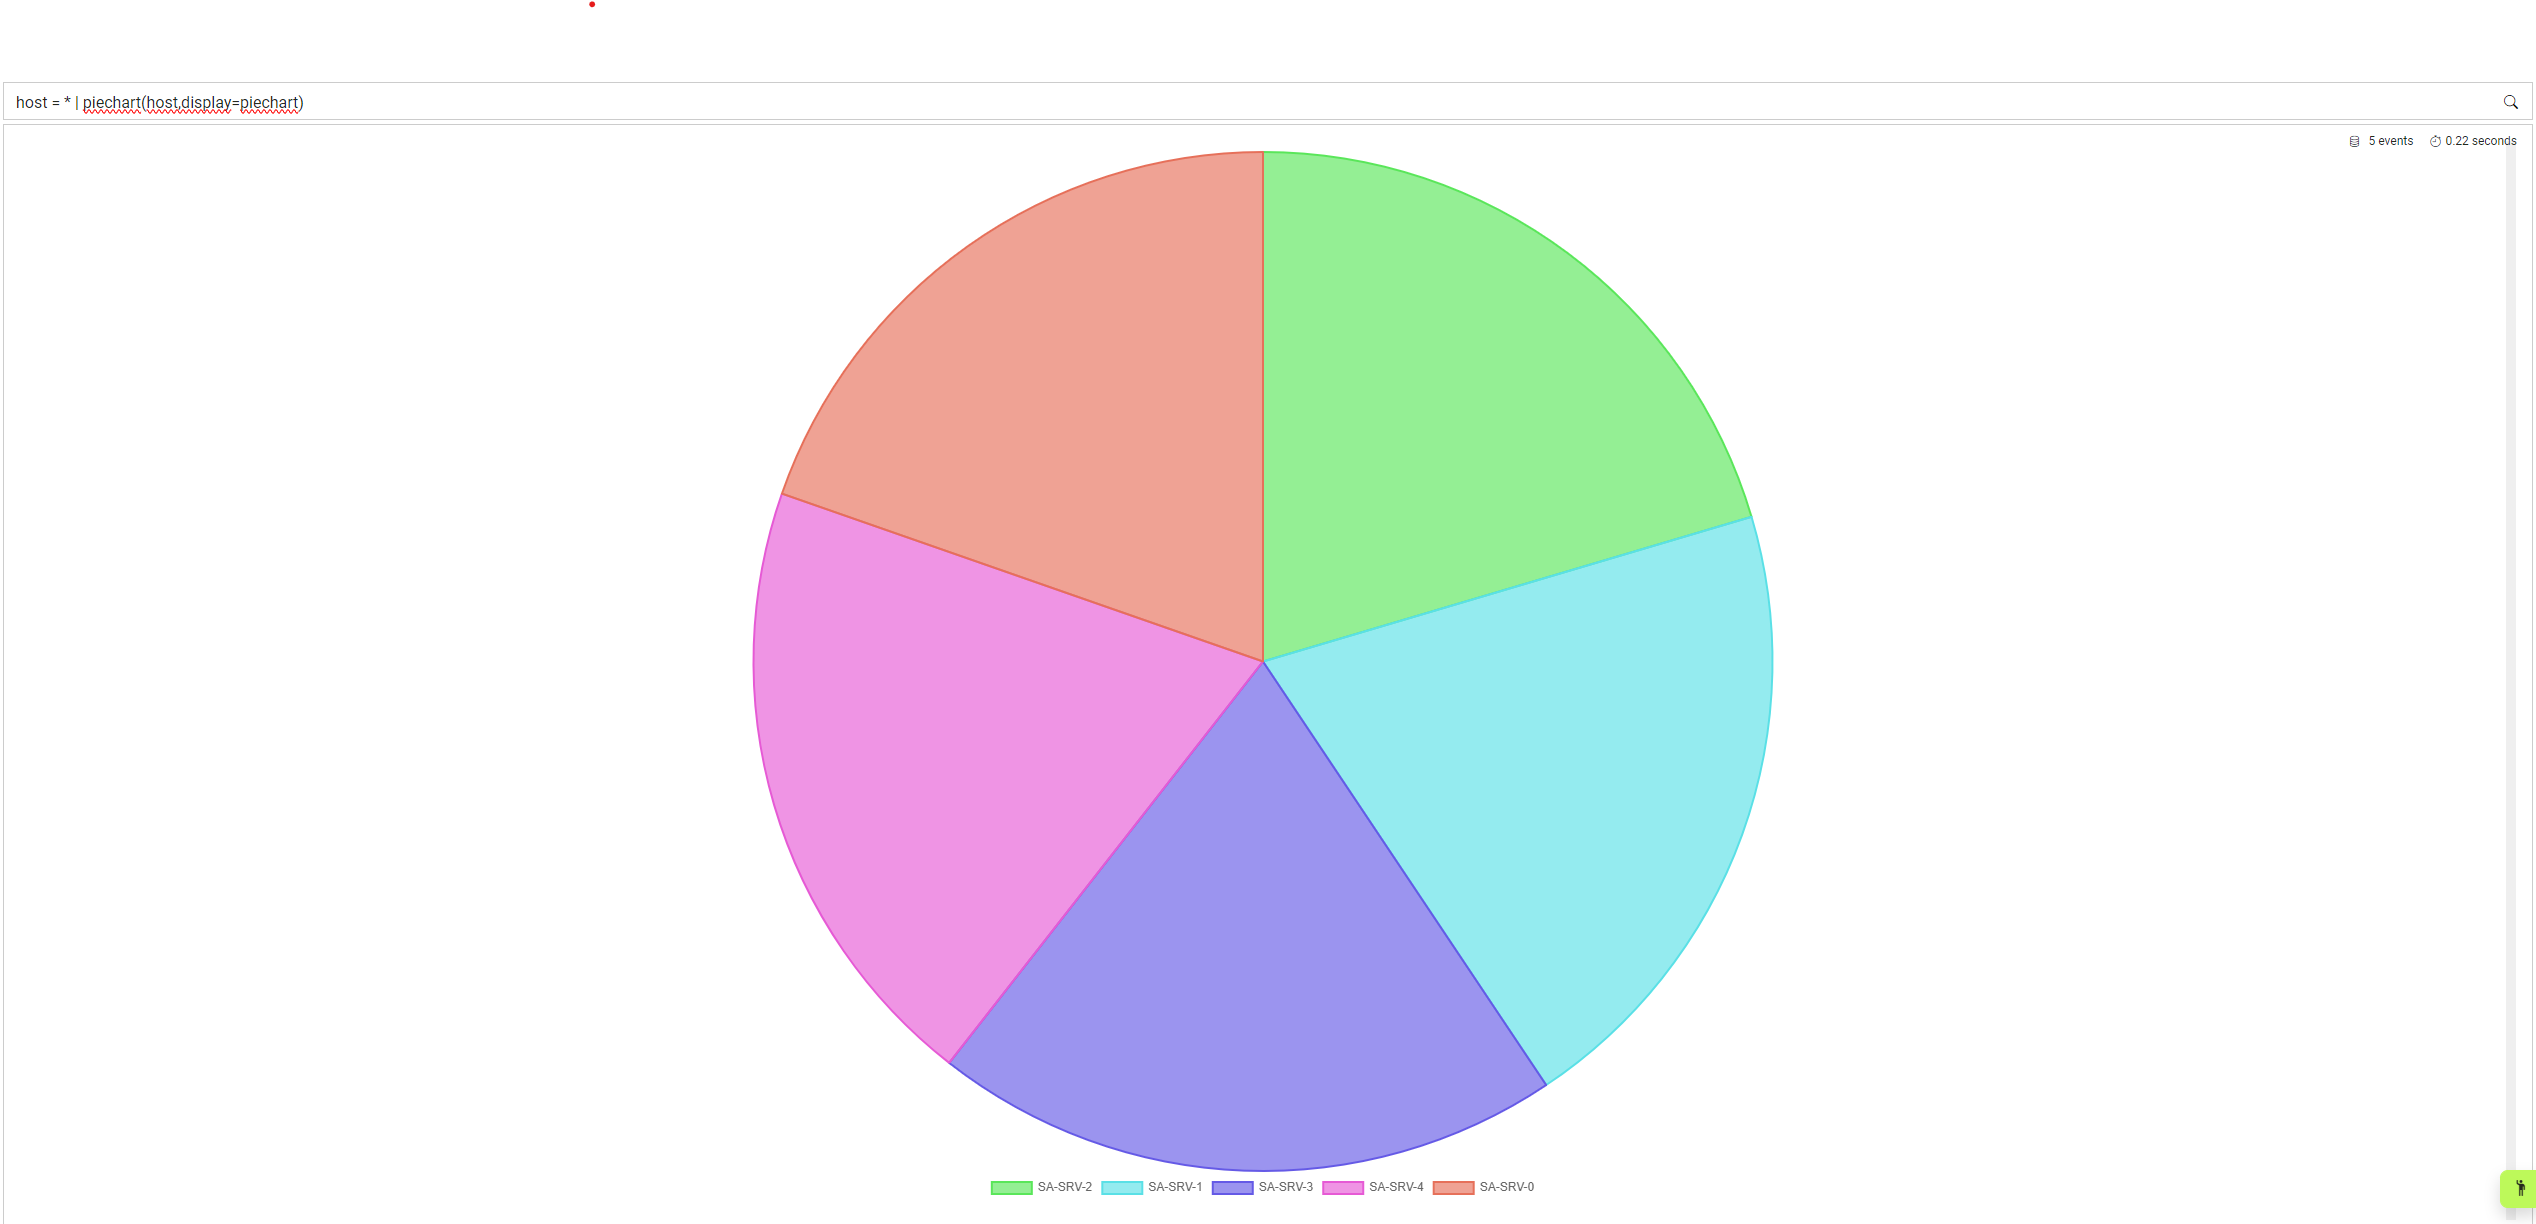
By default the piechart is actually a doughnut, but if you want to change the style you can use the display parameter to choose between doughnut or piechart. This can be done as below:
host = * | piechart(host,display=piechart)
Group
Group allows for events to be grouped together based on the provided fields. For example, to group by hosts, you can use the following:
host = * | group(host)
 Grouping can be done by as many fields as needed.
It is also possible to use metrics to add aggregated data. If you wanted to get the average cpu for each host in table format, you could write this query:
host = * | group(host, metric=avg(cpu))

Select
Select is a way to simply define the fields you would like to table, without grouping by a field or fields. For example, to get each event found in the search, but only display the host and cpu fields, you could write the following:
host = * | select(host,cpu)
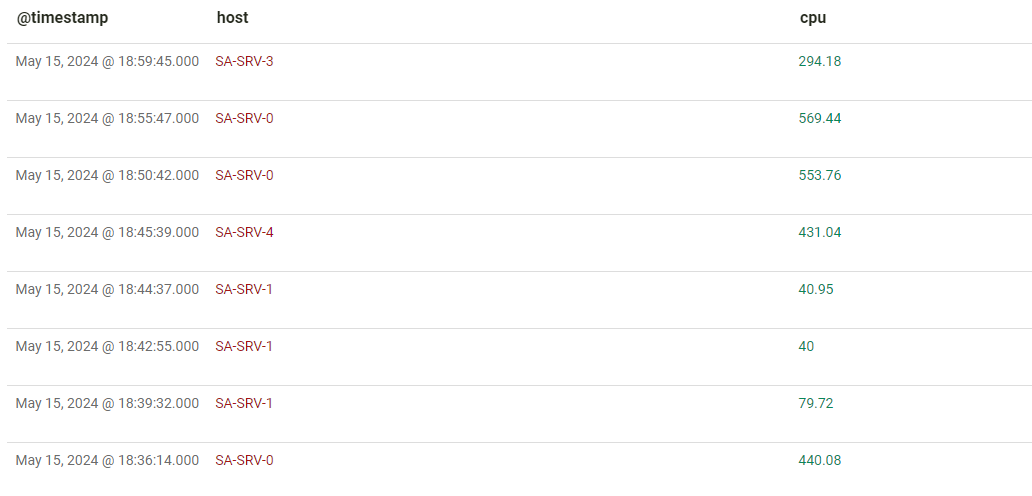
It is still possible to see the other fields in the event by clicking on the expand button in the top right of the event line.

Count
Simply returns a count of the field specified. Multiple fields are not supported.
Sum, Average, Maximum and Minimum
These four functions are identical in their use, with the difference being the operation that they run. These only accept a single field.
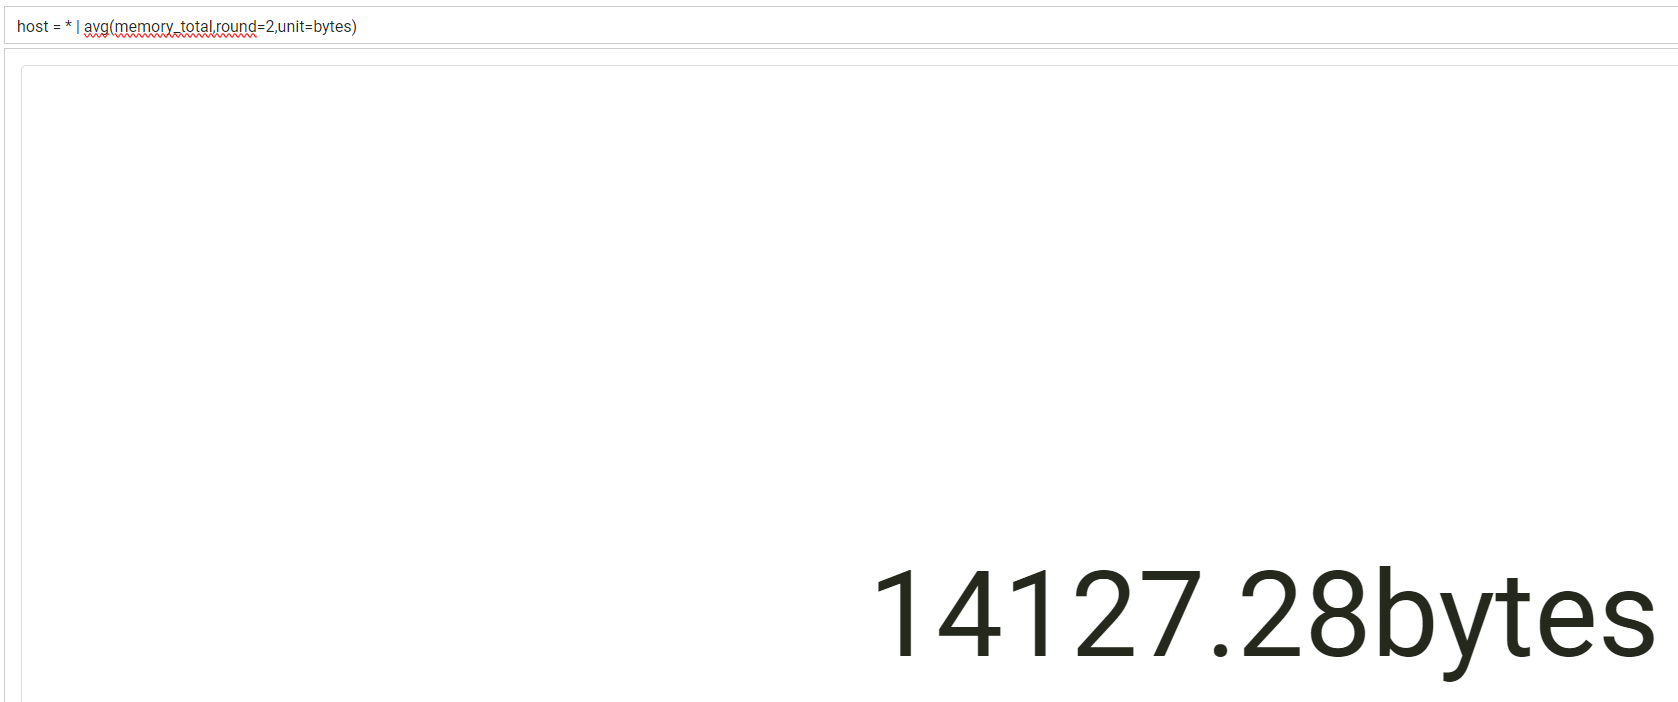
Other than the field, these functions support two optional parameters. The first is round, which specifies the number of decimal points to include. The second is unit, which allows the unit to be appended to the value. For example, to get the average memory across all hosts, rounded to two decimal points, and display it as bytes, the following can be used:
host = * | avg(memory_total,round=2,unit=bytes)
Advanced Functionality
Within investigate, there is also the ability to do some more advanced querying within the search. This includes replacing field names and performing mathematical functions against the data.
Field Replacement
In the event that you wish to replace a field name in your search output, you can use the := operator to specify the field you want to replace. For example, if you were creating a timechart of average CPU, the label of this timechart would be _avg.cpu.

If you want to rename this to averageCPU, you could add the following piped function to your query:
host = * | timechart(metric=avg(cpu)) | averageCPU := _avg.cpu

Field Addition
Similar to the replacement function above, if you want to keep the original field, you can use the :+= operator instead. This results in an extra field being created, rather than replacing the existing field. Using the same example as above, this would look like the following:
host = * | timechart(metric=avg(cpu)) | averageCPU :+= _avg.cpu

Maths
As well as replacing or adding fields, it's possible to manipulate the values of these fields. For example, if we were grouping host by version, it might look like this:
host = * | group(host,metric=avg(version))

However, we want to add 10 to the version, so we can do the following instead:
host = * | group(host,metric=avg(version)) | version := _avg.version + 10

Maths supports the following operators:
+ addition, - subtraction, * multiplication, and / division.
Maths also allows you to reference other fields to use, rather than just static numbers. For example, if we wanted to show average CPU but divide this by the number of cores available, we could write the following query:
host = * | group(host,metric=avg(cpu)) | averageCPU :+= _avg.cpu / cpu_cores

Finally, maths can also be used to replace the metric function. If we take the above example which isn't the easiest to read, we can simplify this down to the following:
host = * | group(host) | averageCPU :+= avg(cpu) / cpu_cores
 If we only wanted to show the average cpu, and not the other two fields, we change the
 :+= operator to :=:
host = * | group(host) | averageCPU := avg(cpu) / cpu_cores

Math functions can be as complex as you would like, and support examples like:
host = * | group(host) | averageCPU := (avg(cpu) / cpu_cores) * 100 + (6 / 2)
Example Investigate Searches
This section includes some example investigate searches that
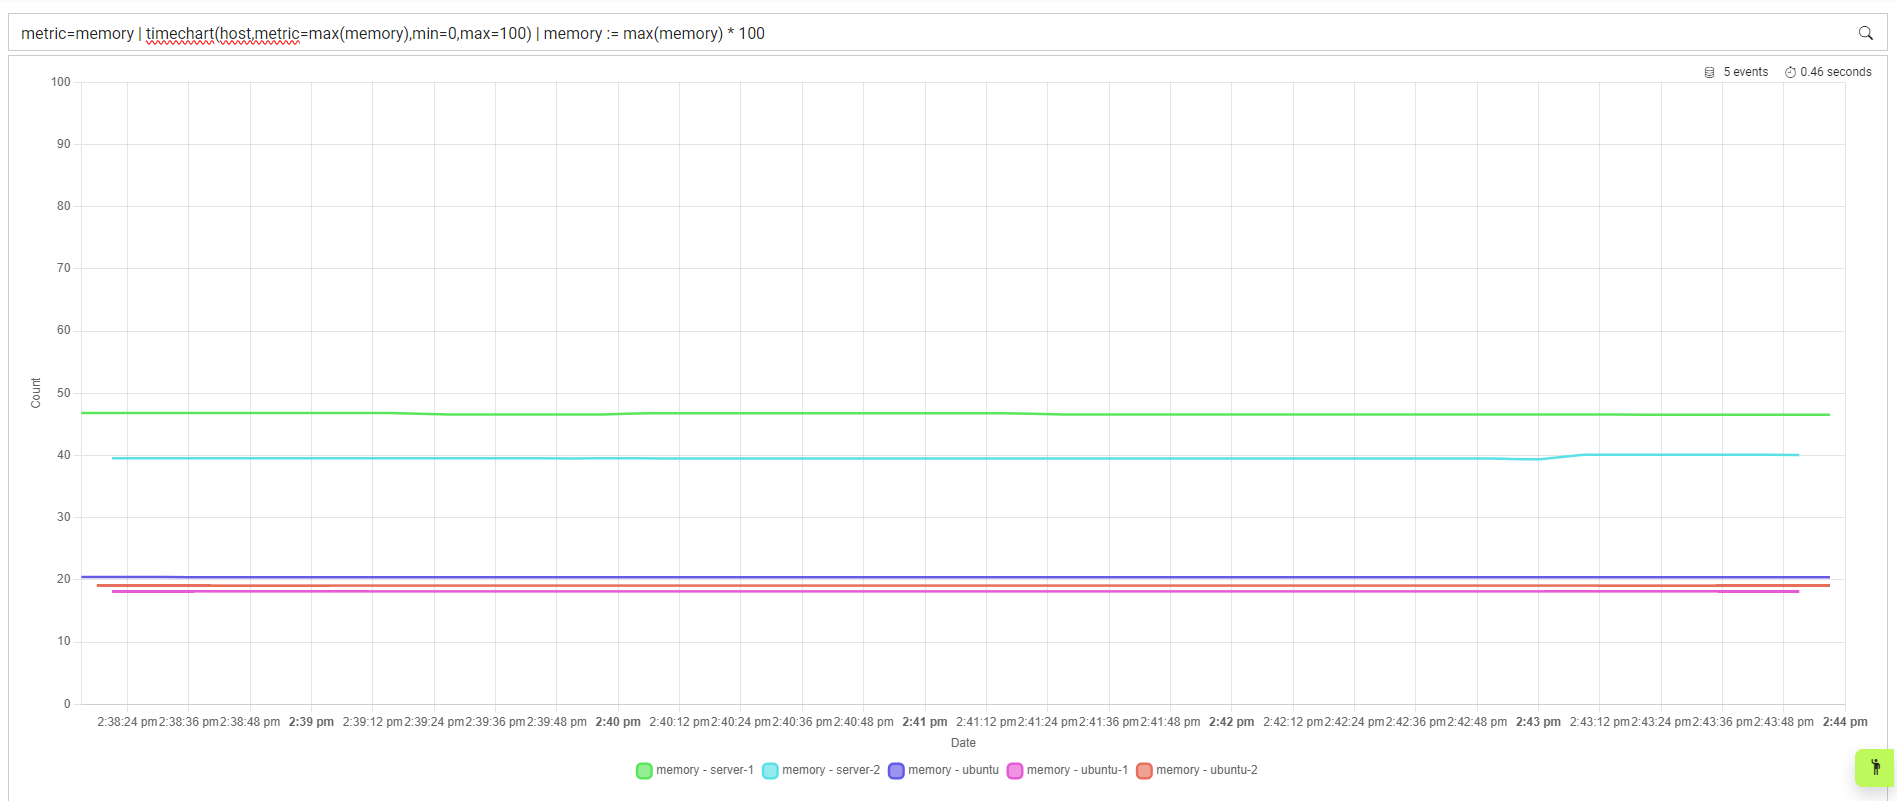
View the Memory usage over-time:
metric=memory | timechart(host,metric=max(memory),min=0,max=100) | memory := max(memory) * 100
View the CPU max usage over-time:
metric = cpu | timechart(host,min=0,max=100) | cpu := (avg(cpu) / max(cpu_cores)) * 100
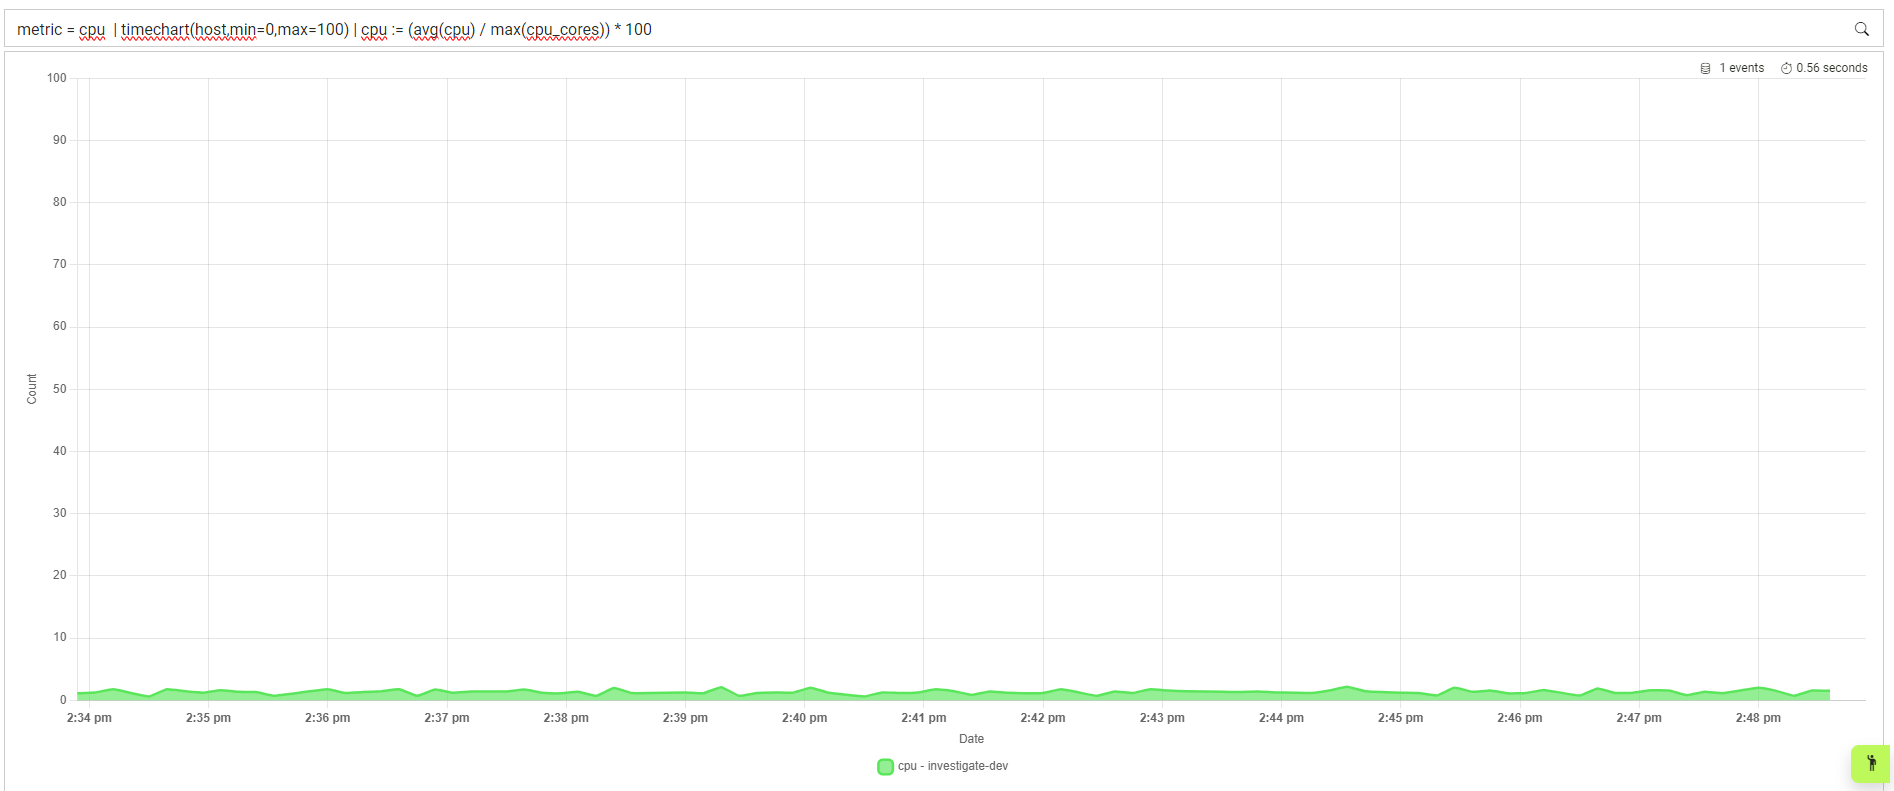
View the Memory and CPU utilisation of a device, based on max, and average values:
(metric:"cpu" OR metric:"memory") and host="server-1" | maxmemory:= max(memory) * 100 | maxcpu:= ( max(cpu) * 100 ) / max(cpu_cores) | avgcpu:= ( avg(cpu) * 100 ) / max(cpu_cores) | group(host:20,maxcpu,avgcpu,maxmemory)

View the uptime of devices over-time while converting miliseconds to days:
metric=uptime | uptime := max(uptime) / 1000 / 86400 | timechart(host:20,metric=max(uptime),min=0)
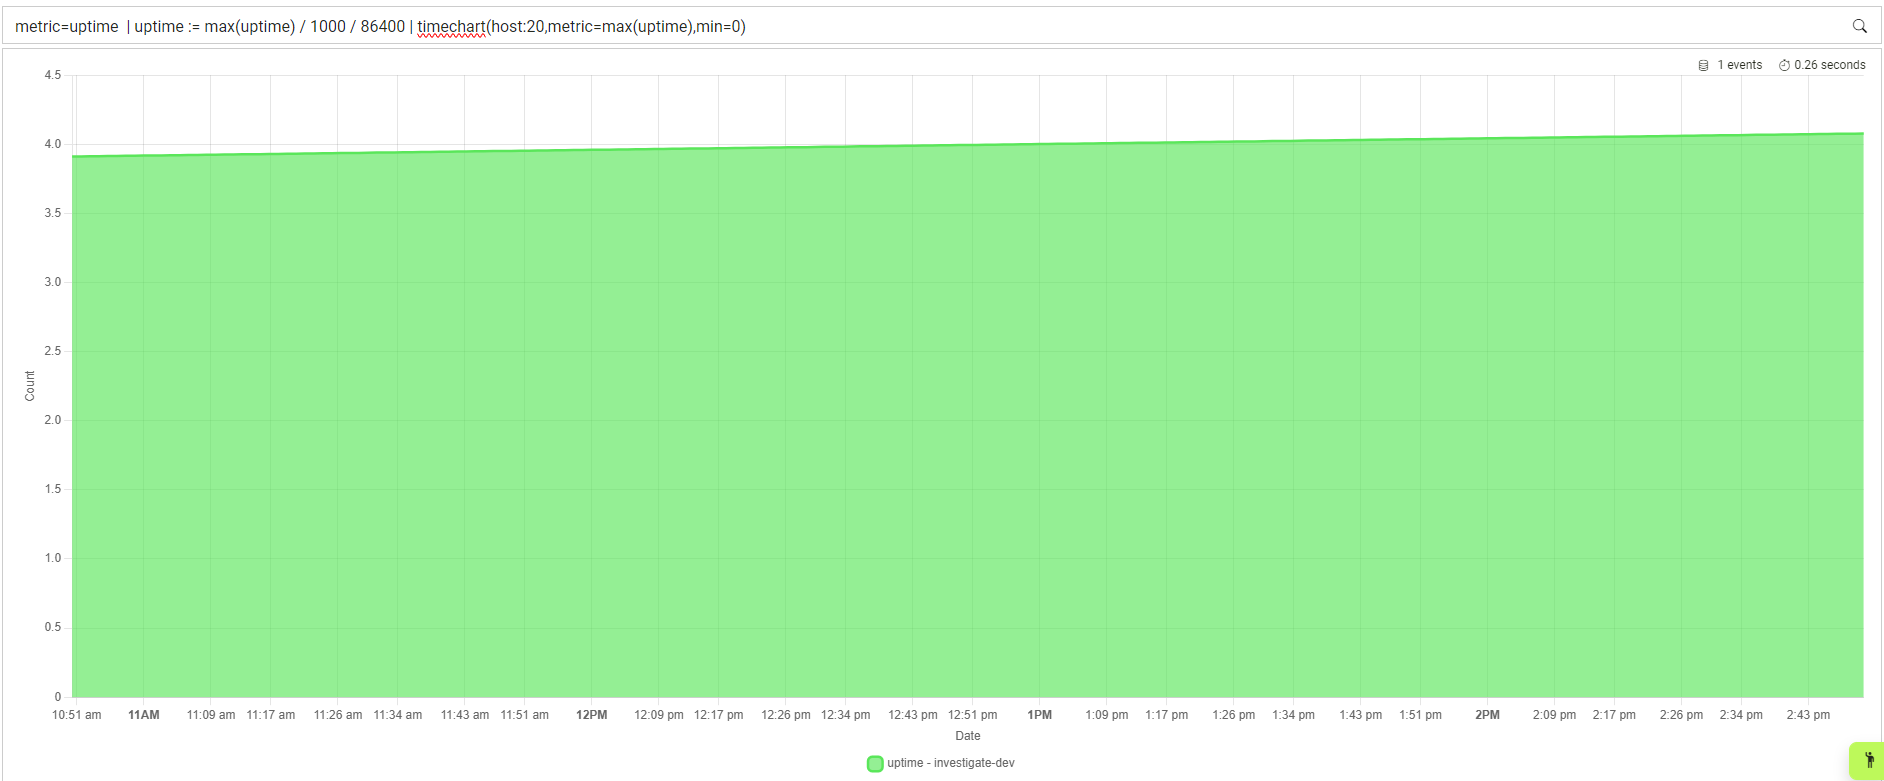
View the highest uptime of devices while converting miliseconds to days:
metric=uptime | uptime := max(uptime) / 1000 / 86400 | round(uptime,2) | append(uptime," days")
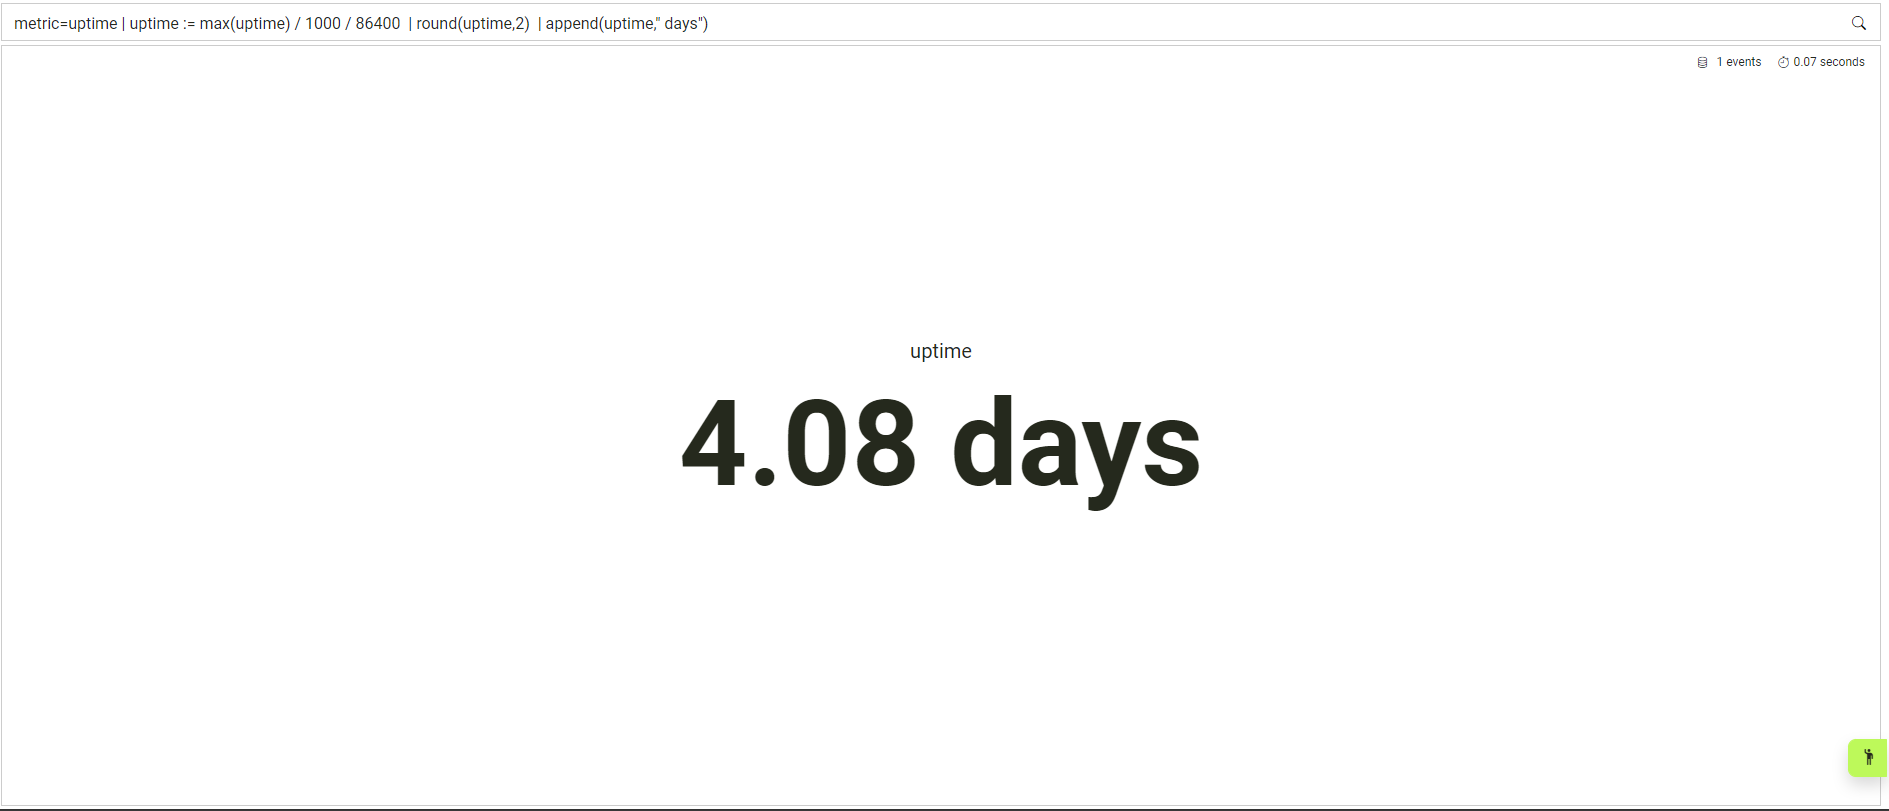
Retrieve the last timestmap a particular process was seen running through logs.
Using this search it is possible to build service monitoring:
host="investigate-dev" and metric=process and cmd_line="systemd-journald" | group(host:5,cmd_line,@timestamp:1:max(@timestamp))

Search that excludes not wanted events:
event_type=authentication and not event_id=4624 | group(event_id:20)

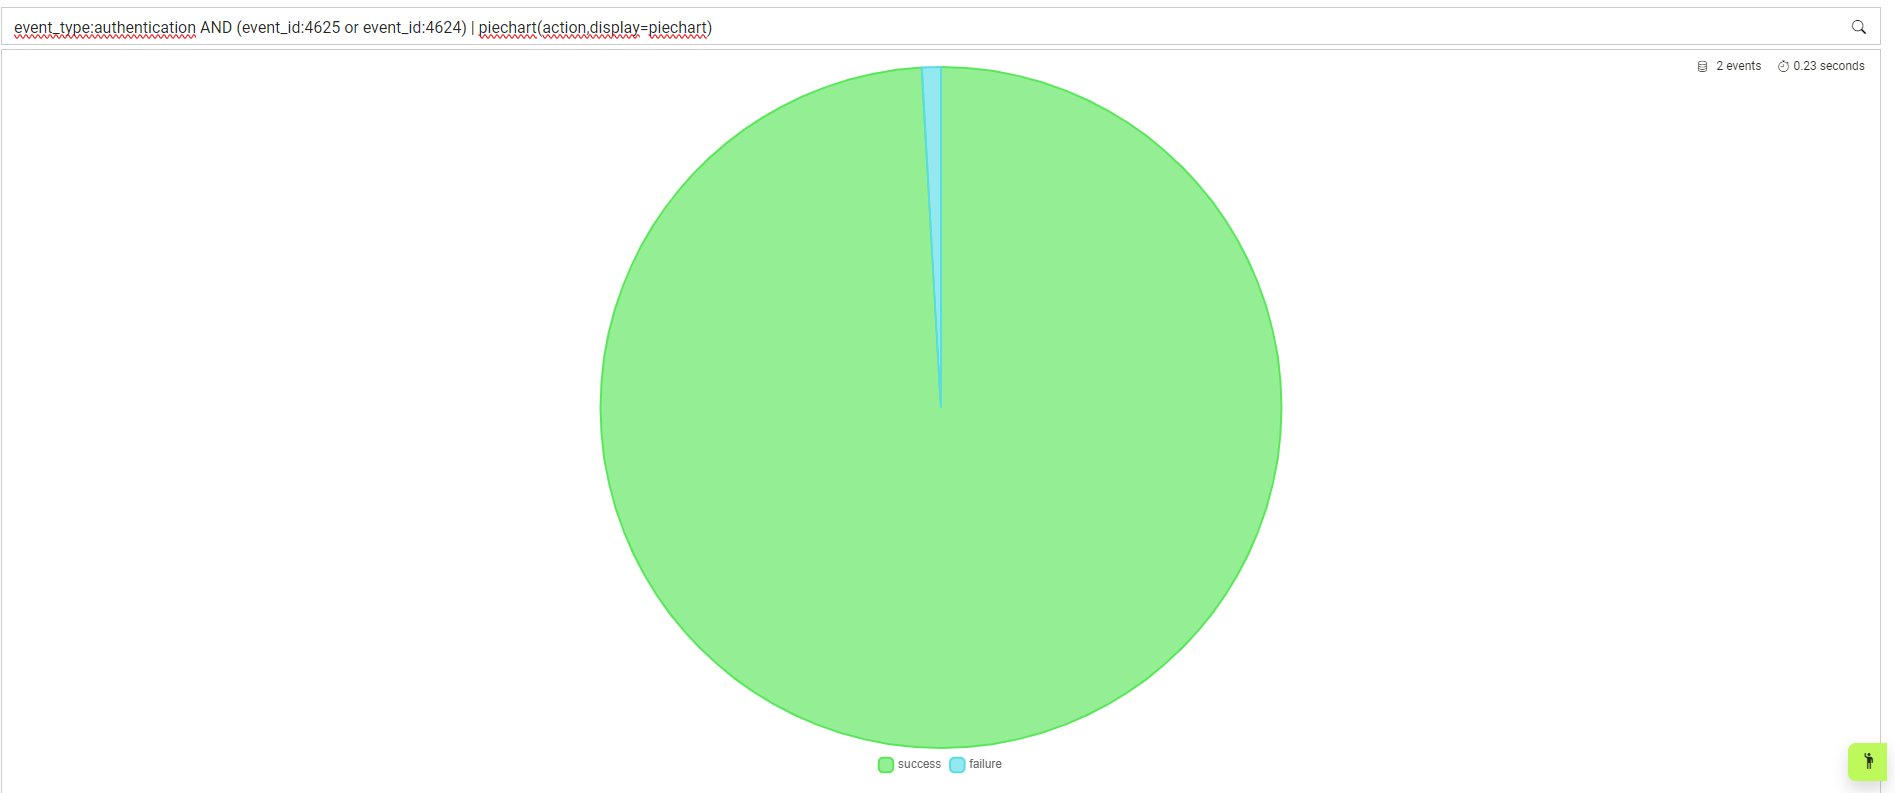
Gauge showing successfull and unsuccesfull Windows authentication attempts:
event_type:authentication AND (event_id:4625 or event_id:4624) | piechart(action,display=piechart)
